

When looking for project management tools, you’ve probably noticed the buzz around Gantt charts. Not just a gimmick, Gantt charts are a visual method for project planning that helps you accomplish your tasks, and work together as a team fluidly. Think of it this way – if your goal of a project management software is to assist you to stay on task, a Gantt chart puts all those pieces (tasks) together for better insights into your project. Ultimately this improves team communication, project efficiency and potentially even grow revenue. But, before we go there, let’s start with the basics.
What do they do?
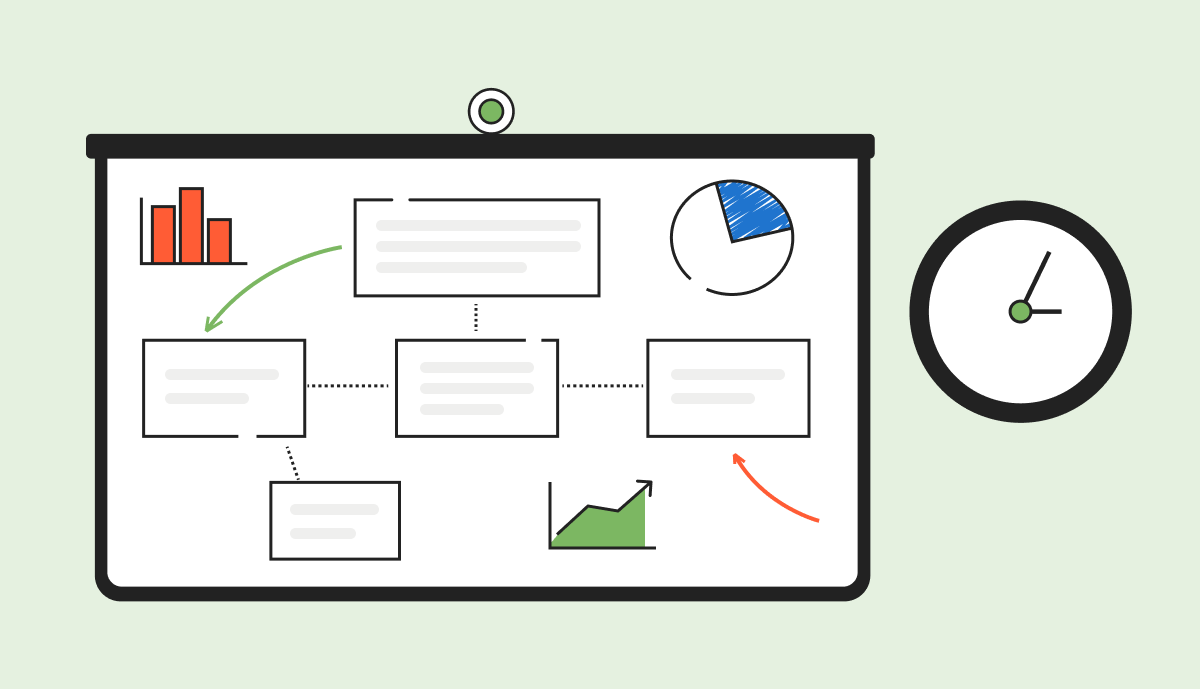
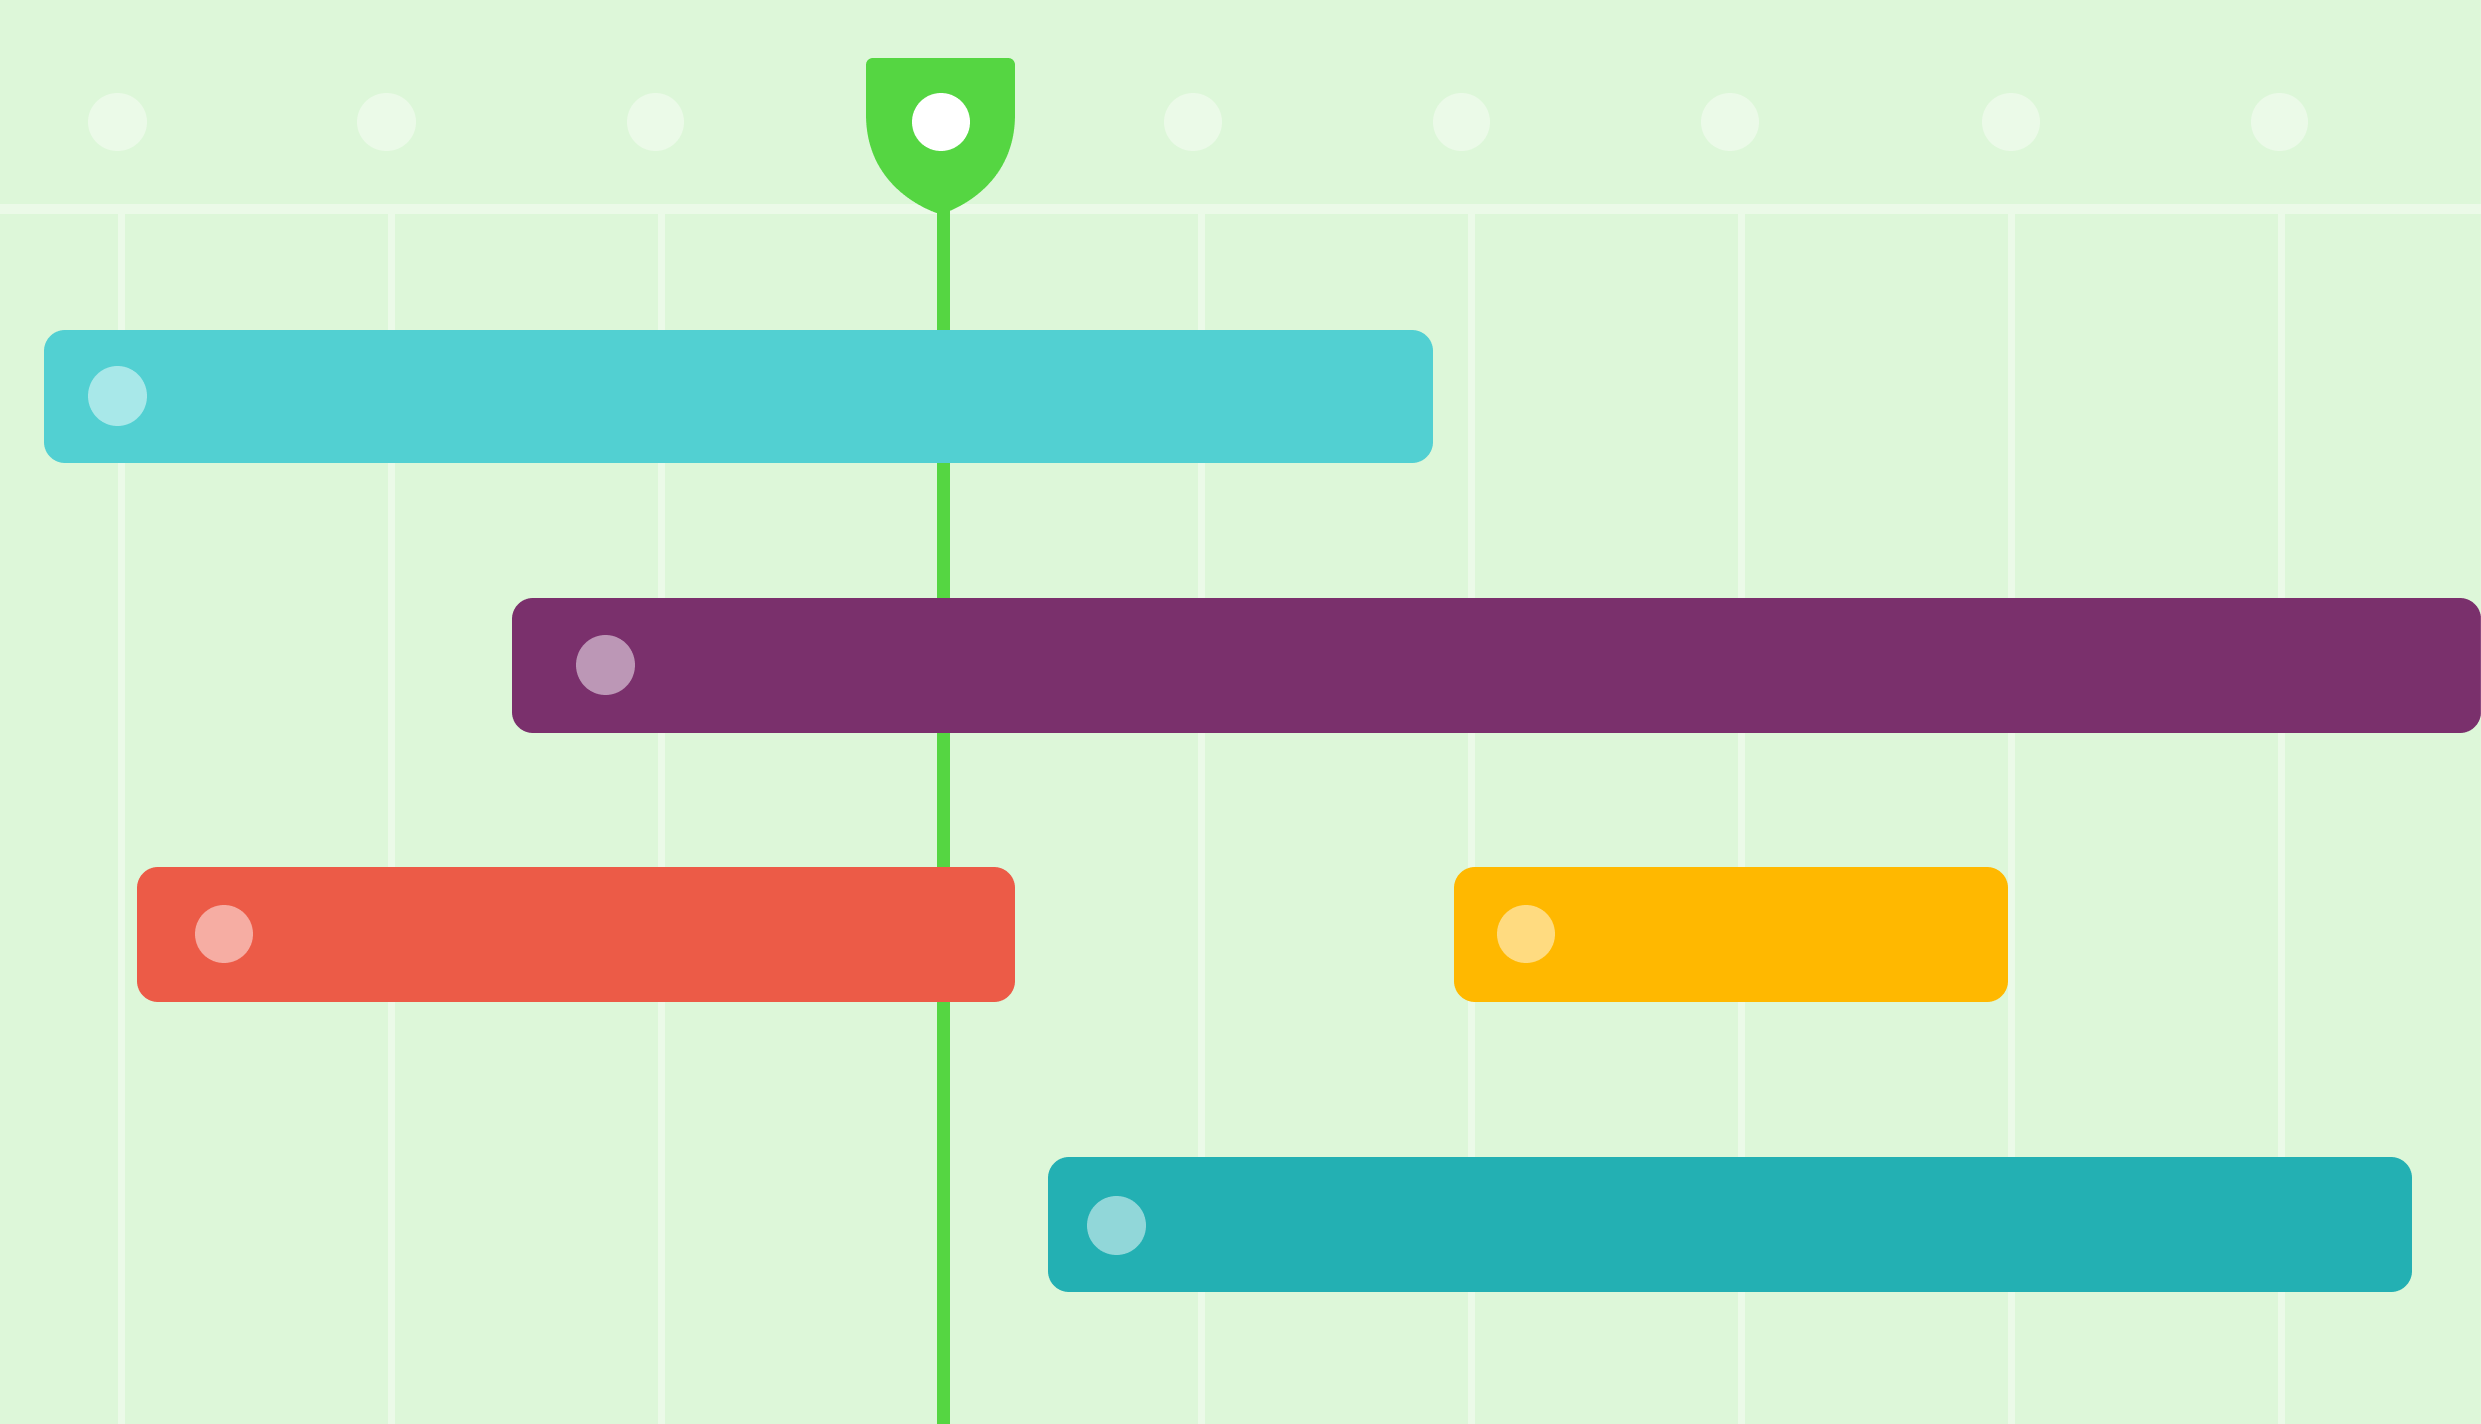
Gantt charts are the strategic framework or mapping of a project. Differing from other forms of project management they let you see the whole route, not just the next turn. Laid out in timeline order, different bars represent the tasks and align to show what tasks are dependent on the completion of another, therefore forming your “critical path”. The critical path is what helps your team then visualize their swim lane and how it fits into the bigger picture of the project. Milestones are also set within the path to make sure you’re achieving key goals, rather than just crossing things off the list.
The real beauty of the critical paths though is that it takes the guesswork out of delivery dates and team expectations. Individual tasks are added up to create the project timeline, and it becomes easier to spot inefficiencies. Different strategies can be applied to how you prefer to map out dependencies on a project to project basis, learn about the different approaches and how to plan for them here.
To see a breakdown of how they work and the different components, check out this infographic on what is a Gantt chart.
What do teams love about them?
Keeps teams connected – Gantt charts highlight how a team needs to come together to make a project successful. When you can easily visualize task dependencies it’s easier to prevent steps from being bottlenecked and open the doors for clear communication.
Allows you to focus on success – The defined critical path keeps your project moving forward towards success. Rather than crossing items off a list, you can visualize how each step brings you closer to success. If roadblocks do occur, you can also easily map out where the necessary changes in the project need to be made to accommodate it and what the risk or set back looks like.
Know where you stand – Although Gantt charts are known as a “big picture” planning tool, they are also very useful in understanding where you stand on the day-to-day. Milestones help divide up the critical path into focus areas or phases of the project. In many tools, you can then work off a task list created by the Gantt chart for the day and then come back to see the progress made in full on the chart.
When do you use Gantt charts for project planning?
Are you working on a building block project? Check.
If your project’s tasks are largely dependent on each other, then it’s hard to visualize how all those blocks need to stack up for a project to be successful. A Gantt chart helps your whole team visualize “the build”, and then divide and conquer.
Do you have large task “chains” to produce each deliverable? Check.
When you have three or four tasks that need to be completed before you can see a deliverable, tasks on the back-end of the chain tend to get squeezed. That happens because there’s no clear visual consequence when your team runs over on tasks at the start of the chain. Gantt charts help solve that by making it clear that a front-end task isn’t done until it’s dependent task has begun.
Are you schedule or resource-constrained? Check.
You don’t need a Gantt chart to tell you that one person with ten tasks isn’t the project-management equivalent of ten people with one task. But, your manager might. Gantt charts help identify the dependent sections of a project that can be given out as a unit to different resources. They can also work backward from a deadline: clarifying the total team required to meet a specific milestone.
Working on a product roadmap?
Commonly confused, but not always the right fit for Gantt charts. Check out our blog distinguishing the two to learn more on if you’re making the right choice.
To learn more about how Gantt charts and our other project and resource management tools can work for your firm, request a product tour of our software here.