
You’re set on a project plan, resources are allocated, budget is locked in, and the project is moving along. Both you and your client are asking the same question: how is the project progressing? You might even want to know more: will it finish on time and on budget? Will the project ROI target be achieved? Exactly how much over (or under) budget will we be?
You probably have ways to get these answers, but the question is, how quickly? Likely not quickly enough. So we connected a few dots…
- We know you need insight throughout a project’s life cycle to stay on track.
- We know how powerful images can be.
- We know that visualizing data can illustrate the full story behind a project, all in just a glance.
So through discussions with you, the project vitals tab was born.
What’s that? When you click into a project in BigTime, the project vitals tab is now the first thing you’ll see. Your key data will be displayed in a simple dashboard as charts and diagrams. Project vitals is here to make sure you always have a handle on project progress, and if you ever feel like you don’t, you have a clear destination that quickly gives you a sense for that project’s progress. All in real time.
Why we built it
One of the best ways to understand your data is to see it in a diagram or chart. Data visualization is an increasingly key way to make sense of the data your firm generates daily. This is precisely why we created project vitals, a space within each project that translates your key data points into succinct, easy-to-read charts. Project vitals provides a quick, real-time, and comprehensive look at a project’s progress, status, and overall health.
Let’s dig into what this means.
How it helps
What metrics define project health? After talking with you, we whittled down a long list of metrics to eight. If we get into the nitty gritty, the project vitals tab includes four essential charts and four key metrics that represent the health of any project. We anticipate the vitals dashboard to be used primarily by project managers and admins. However, it’s really for anyone that wants to dive into project-level data without spending a ton of time downloading and analyzing project-specific reports. We ultimately want project vitals to show you how a project is exceeding or missing expectations.
Finally, a note on the project vitals dashboard design. We didn’t want to introduce an overwhelming dashboard that provided more confusion than it did clarity. That’s why project vitals is a simple, curated screen that can give you a clear picture of your project’s health.
Where to find it
Each time you click into a project, you’ll automatically see your project vitals for a quick, visual snapshot of your project performance. Vitals will be your very first tab, every time.
What’s in it
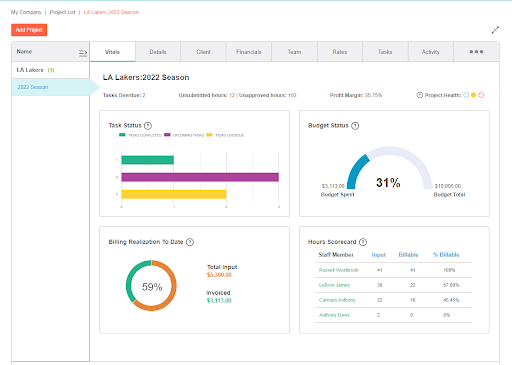
Your project vitals dashboard include four charts and four metrics.
Charts include:
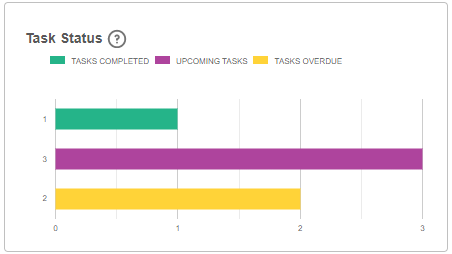
1. Tasks completed chart
See how many tasks have been completed in a bar chart format. You’ll see one bar for tasks completed, one for upcoming tasks, and one for tasks overdue. Get insight into team productivity and trends.
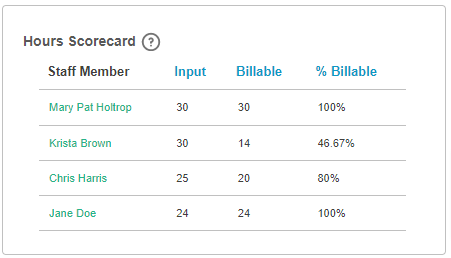
2. Hours scorecard chart
See who has billed the most hours, as well as the ratio of input versus billable hours. The chart is sorted from most billable staffer to least billable and creates a metric for staff performance at the project level.
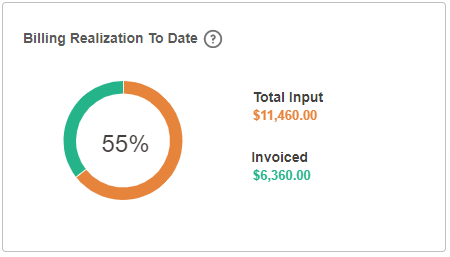
3. Billing realization chart
You already have access to this donut chart, but it now lives in your vitals tab! We also updated it by including total input and total invoiced amount next to the chart for added context.
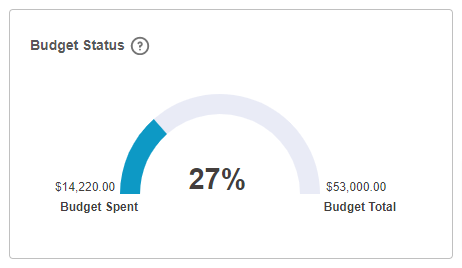
4. Budget status chart
The budget status chart looks like the gas gauge in your car. It sums the budgets for all the tasks within a project and shows budget burned as both a percentage and an actual dollar value.
 Your project vitals tab also includes four metrics across the top for quick facts and insights.

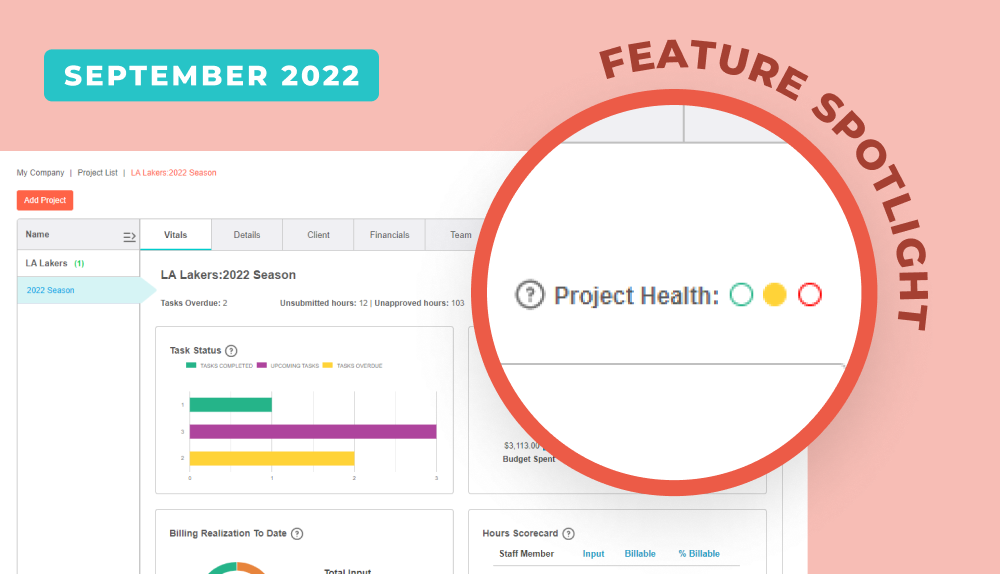
The project health stoplight indicates budget burn and pace.
Green → your project is both within budget and on track
Yellow → your project is either over budget or there are tasks overdue
Red → your project is both over budget and has overdue tasks
The other three metrics we included are overdue tasks, unsubmitted and unapproved hours, and profit margin (shown as a percentage).
How it works
Take a peek into the planning board before you try it out yourself.
Our hope is that project vitals removes the noise around your data and brings actionable insight to the forefront. We know it’s important that you can always articulate the story behind each project, especially as you scale. We are so excited for you to check out your project vitals tab.
Let us know what you think at product@bigtime.net, and if you’re interested in reading about other new features and updates from this month, check out the September monthly release.
New to BigTime? Request a personalized demo and tell us a little bit about your concerns. We’ll cover what’s relevant to you and nothing that isn’t.